
Created by: Lee Barrow
Last Updated: 07 26 2019
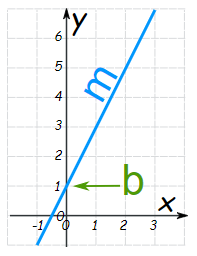
As discussed in class, we know that a linear equation can be written in the form y = mx + b (slope intercept form). We also discussed that all linear equations, with two variables, will represent a line. |
|
For this topic, we will observe that any quadratic equation of the form Unlike linear equations, two points are not enough to determine the equation of a parabola. For this section, we will determine a minimum of 5 points to produce a rough sketch of any given parabola. For the example below, we graph our parabola by plotting points—with x our independent variable and y our dependent variable. |
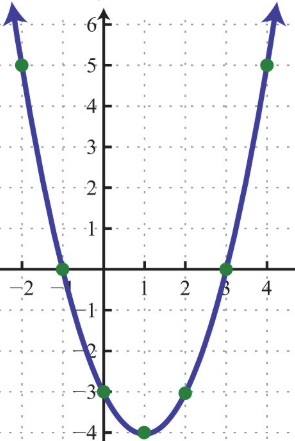 |
Directions: Prior to reviewing the solution, attempt each example below on graph paper. Please print here, if graph paper is needed. Example 1: Graph by plotting points: y = x^2-x-6 Solution: For this example, choose the x-values {-2, -1, 0, 1, 2} and calculate the dependent value.
|
|
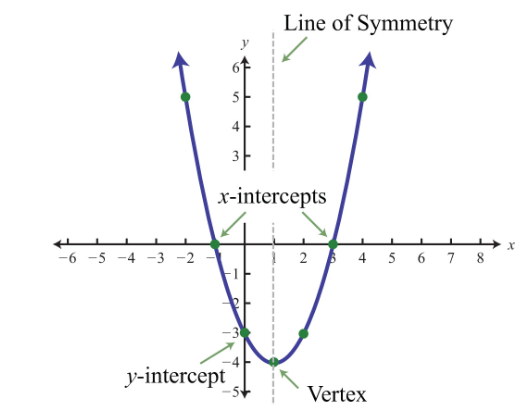
When we graph parabolas, there are unique points we want to identify: y-intercept, x-intercepts, line of symmetry, and the vertex. The y-intercept is the point where the parabola intersects the y-axis. The x-intercepts are the points where the parabola intersects the x-axis. The vertex is the point where the parabola switches from increasing to decreasing (maximum) or decreasing to increasing (minimum). Finally, the axis of symmetry is the vertical line through the vertex of the parabola, which cuts the graph symmetrically.
Continue to next section
|
|

Need extra help?
Forgot how to graph on the x-y plane? Need a recap on how to plot points and how to determine the difference between graphing lines and parabolas? Watch this!
Having troubles with example 1? Watch this for a more detailed walk-through.
|
|